
After a strong performance in the third quarter and over much of the past decade US stocks had their worst month in seven years in October.
US stocks sank over 7% and international stocks fell over 8%, even after rallying over the last few days of the month to lessen the declines. There were a variety of reasons propelling the market dive including weak corporate earnings’ outlooks, interest rates climbing early in the month, geopolitical concerns over the death of a critic of the Saudi government and increasing fears that additional tariffs will be levied between the US and China.
The resulting declines made it difficult for many investors to remain calm over the month. However, it’s important to remember that volatility of this magnitude is common in the stock market. The following chart shows the calendar year by year performance for the US stock market since 1979 in the blue bar. In addition, it includes a black line for the largest intra year gain and red line for the largest decline. You’ll see that virtually every year had a period of a significant decline even when performance for the year was positive.
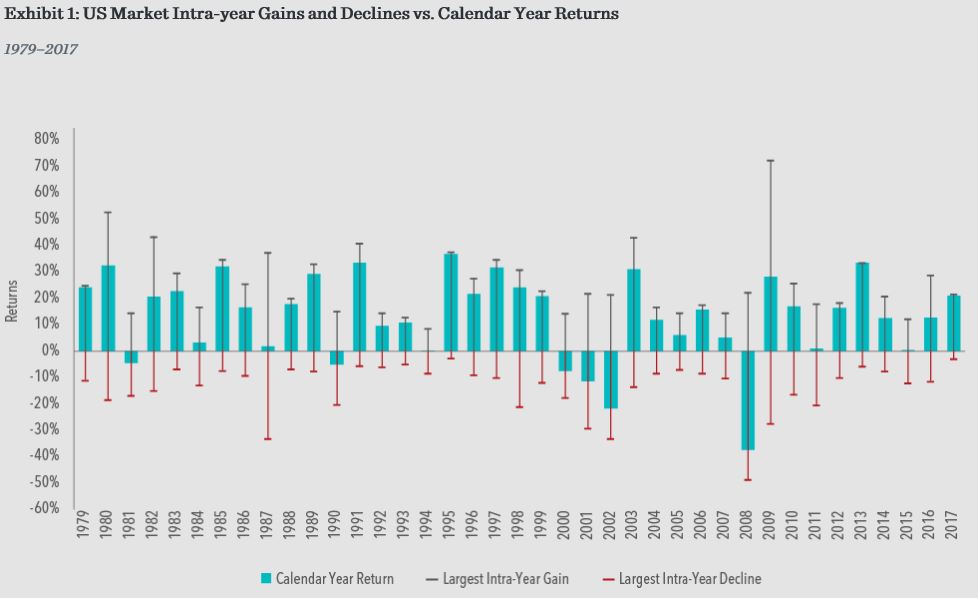
Over the last 39 years the average intra-year decline was 14% and roughly half of the years had declines of over 10%. It shows just how frequently negative performance has occurred each year over this time period and often times even worse than what we saw over the past month.
This is further reason for our belief that in order to receive the full return offered by the market an investor needs to remain disciplined in the face of significant market volatility. By avoiding the urge to jump out of the market when times are rough it can help best position your portfolio to meet your long term goals.
(Source Dimensional Fund Advisors. US Market is measured by the Russell 300o Index. Largest intra-year gain refers to the largest market increase from trough to peal during the year. Largest intra-year decline refers to the largest market decrease from peak to trough during the year. Frank Russell Company is the source and owner of the trademarks, service marks and copyrights related to the Russell indexes.)