Raffa takes a deeper look at how a handful of technology stocks have come to dominate the US stock market and what we believe investors should be doing to best set themselves up for long term success as a result.
A strong 2023 in the US stock market and the stellar performance from just a handful of large tech companies has sparked conversations among investors about one topic in particular: market concentration. Will these large tech titans continue to dominate and drive overall market performance? Is my portfolio positioned for success over the long run? Let’s take a deeper look.
2023 was a very strong year for the stock market and it was primarily driven by the “Magnificent 7.” This group of 7 stocks: Nvidia, Meta, Apple, Amazon, Microsoft, Alphabet, and Tesla drove roughly a third of the market’s growth from the last market low in October 2022 through the end of 2023. Due to this significant growth, these stocks now account for nearly 30% of the US stock market as measured by the S&P 500. This is the largest degree of concentration in the US stock market in more than 24 years. While the Magnificent 7 stocks have posted strong performance to become the largest stocks in the market, history shows that this strong performance doesn’t persist. In fact, data shows that once stocks enter into the top 10 largest stocks, they typically trail the broader stock market moving forward. [1]
Given the substantial increase in stock prices we’ve seen from the Magnificent 7 stocks, and other large growth stocks, their valuations have reached levels significantly above historical averages. This compares to smaller company value stocks, which have valuations that are below historical averages. Thus, by emphasizing large growth stocks in a portfolio you are paying significantly more than average, whereas you would be paying less than average to buy smaller company value stocks.

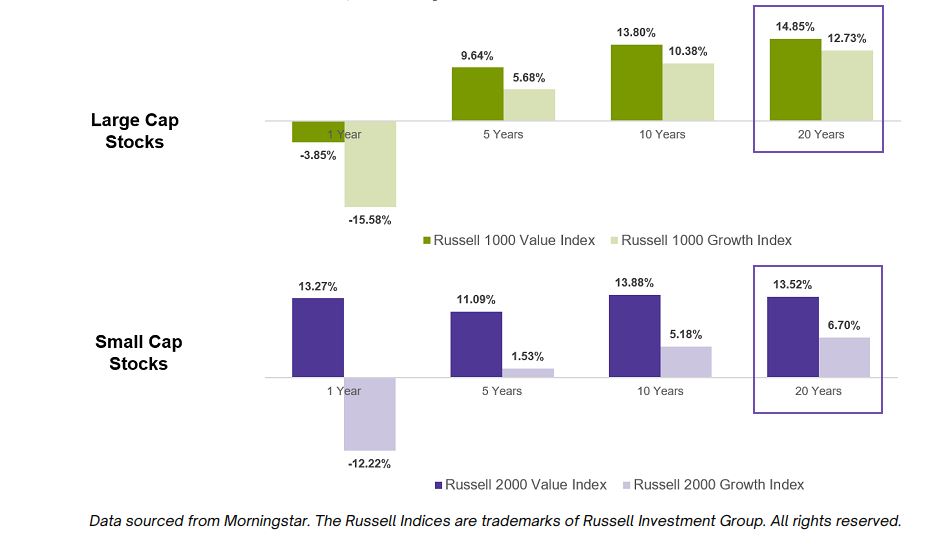
The last time we saw valuations this high for growth stocks, particularly large growth stocks, was in the late 1990’s. Like today, those stocks had been through a period of strong performance.
Periodic Value index performance, December 31, 1999

However, that strong large growth stock performance changed very quickly. In just 26 months, value stocks went from trailing over the previous 20 years to outpacing those growth companies considerably over the trailing 20 years.
Periodic Value index performance, February 28, 2002 (26 months later)

This type of performance reversal has occurred several times before. When we look at the trailing 20-year return difference between large-cap stocks and small-cap value stocks, after the last three low points for small cap value stocks’ relative performance, small-cap value stocks have rebounded and outperformed large caps by more than 3% annualized over the three years following their relative low point. This is a major reversal.
While the returns of the Magnificent 7 may look attractive over the past year, we believe diversifying away from a heavy concentration in a handful of large cap growth stocks and emphasizing small cap and value stocks is a smart investing strategy that is positioned to perform well in the coming years.
Click below to download this Investment Insight as a PDF!
Disclosures:
For informational purposes only. All figures in USD. Indices are not available for direct investment. Index returns are not representative of actual portfolios and do not reflect costs and fees associated with an actual investment. Actual returns may be lower.
All economic and performance information is historical and not indicative of future results. Different types of investments involve varying degrees of risk, and there can be no assurance that the future performance of any specific investment, investment strategy, or product made reference to directly or indirectly in this material, will be profitable, equal any corresponding indicated historical performance level(s), or be suitable for your portfolio.
You should not assume that any discussion or information provided here serves as the receipt of, or as a substitute for, personalized investment advice from Raffa Wealth Management or any other investment professional.
The charts and graphs contained herein should not serve as the sole determining factor for making investment decisions. To the extent that you have any questions regarding the applicability of any specific issue discussed to your individual situation, you are encouraged to consult with Raffa Wealth Management.
All information, including that used to compile charts, is obtained from sources believed to be reliable, but Raffa Wealth Management does not guarantee its reliability. All performance results have been compiled solely by Raffa Wealth Management, are unaudited, and have not been independently verified. Information pertaining to Raffa Wealth Management’s advisory operations, services, and fees is set forth in Raffa Wealth Management’s current disclosure statement, a copy of which is available from Raffa Wealth Management upon request.
[1] Annualized return in excess of market return for stocks after joining list of 10 largest US stocks, 1927-2022. After joining list of top 10 largest US stocks, those companies trailed the market by -0.9% and -1.5% annually over the next 5 and 10 years, respectively. Companies are sorted every January by beginning of month market capitalization to identify first time entrants into the 10 largest stocks. Market defined as Fama/French US Total Market Research Index. The Fama/French indices represent academic concepts that may be used in portfolio construction and are not available for direct investment or for use as a benchmark.
<

