

There are many factors that drive the performance of the markets throughout the year: corporate earnings, economic news, central bank policies, geopolitical factors among others. Every four years, another event is thrown into the mix that investors from around the world will be watching closely, the US Presidential Election. With another charged election on the horizon in November, many nonprofit and association investors are wondering: how will the election impact my returns? Is now a good time to be invested? What actions can I take to ensure my portfolio is set up for success?
To help address these concerns, we reviewed historical data to provide context for what we’ve seen in past election cycles. We also examined key policies and practices that can enable your investments to weather volatility in the markets, and thrive during times of uncertainty.
The Market and us presidential elections
hypothetical growth of $1 invested in the S&P 500
1926-2023
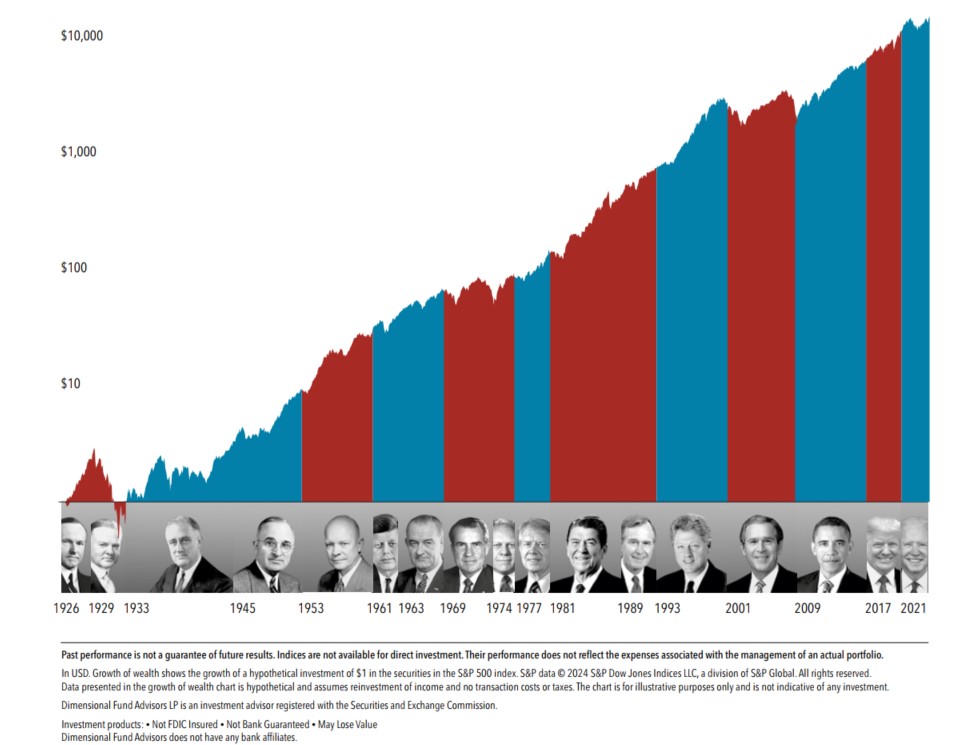
how has the stock market performed in election years?
While many individuals may feel strongly about one party being in office, when we look at the broader stock market through the years, the market hasn’t historically shown favoritism toward one party versus the other. Zooming out, history shows us that regardless of which party is in office, stocks have continued to climb upwards. The Presidential election is just one of many factors that are considered by the market when arriving at stock prices. Investors that remained in the market benefited from these positive returns over time. While emotion may drive an urge to divest or reduce stock allocations as the election nears, the data clearly shows that investors who remain disciplined through the noise have the best chance for long term success.

Despite the stock market’s continual climb over the long term, if we just focus on the time shortly before and after the election, we see that historical performance has varied. On average, the US stock market has been positive three months before the election as well as three and six months after the election, yet there have been times when the market has seen significant pullbacks around the election.
how can i prepare our portfolio and investment policy for market volatility?
We can all cross our fingers and hope that history repeats itself and this election year brings positive returns, but in reality we know that past performance is no guarantee of what’s to come. This is why it’s important to have well written investment policies in place to govern your investments should something extreme occur. Critical policy considerations that can aid in weathering volatility are asset segmentation, downside protection, and rebalancing.
asset segmentation
Asset segmentation describes the process of splitting your organization’s overall reserves into different buckets based on the timing of cash flows and goals for the funds. Ensuring that you have an adequate amount of funds set aside to sustain your immediate operating needs is paramount before investing any dollars in riskier investments like stocks. Once your immediate operating expenses are met, and any funds you may need in the short term are conservatively invested, then it becomes more appropriate to invest funds in a longer-term portfolio that can be invested in a more growth-oriented manner. Splitting your organization’s assets in this way helps limit the possibility that you will need to draw down on stock investments during times of significant volatility. In advance of the upcoming election, make sure your organization has reviewed how its overall assets are segmented to ensure you have an adequate amount invested conservatively to cover any short term needs.
downside protection
For funds held in a long term portfolio, it is essential to have the right controls in place to provide downside protection in times of stock market disruption. This is where two crucial policy components come into play: diversification requirements and credit quality. Ensuring your portfolio is broadly diversified across both US and international stocks, as well as all size and style types is critical in ensuring your portfolio isn’t too concentrated in one area. The US stock market for example, has become historically top-heavy with a handful of large-growth tech companies accounting for a significant chunk of the market; having a strategy in place to tilt away from this degree of concentration can provide for a smoother return experience.
On the fixed income side of the portfolio, a minimum average credit quality is a key component to managing risk. Historically, we’ve seen high credit quality fixed income investments perform well in times of stock market disruptions. High credit quality fixed income performed very well, for example, when the stock market sank at the onset of the COVID-19 pandemic. By maintaining an emphasis to higher credit quality fixed income, your portfolio can be better protected from large equity declines with your fixed income acting as a source of stability for the portfolio.
rebalancing
Rebalancing is another key policy component that can enable you to take advantage of significant market volatility. A rebalancing policy ideally provides clear direction on when to buy and when to sell from an asset class. In the event of a market downturn, when other investors may let fear dominate investment decision making and reduce stock exposure or exit the stock market entirely, investors who have a strong rebalancing policy enable decisions to be made objectively allowing them to take advantage of the situation. Should the market decline to a point where your asset allocation moves out of tolerance with your policy targets, the rebalancing policy will dictate you to sell from what is overweight in the portfolio (likely bonds) and buy what has declined (likely stocks), helping you make the tough decision to buy low and sell high. The below chart is an example of a rebalancing policy being triggered by asset class movements.
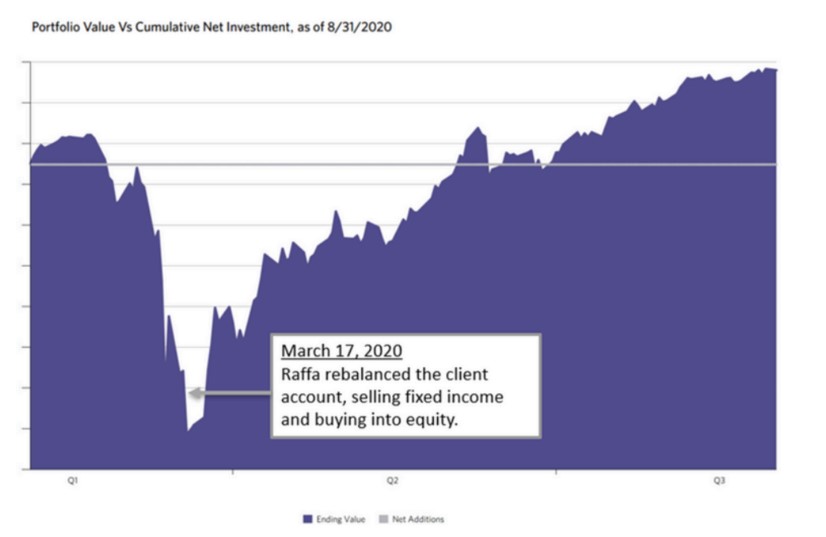
For long term investors, having the fortitude to buy stocks after a market correction can better position your portfolio for long-term growth. As we’ve seen in the past, given time, the stock market has rebounded after market declines and rewarded those who have stayed invested. Buying an asset after seeing a steep decline can be unsettling, yet we’ve seen this type of rebalancing work well for investors time and time again. Having a clear rebalancing policy in your Investment Policy Statement will help your organization remove emotion from the decision-making process and remain disciplined, which can lead to better results over the long term.
The upcoming Presidential Election can bring about a variety of different market outcomes. While historically we’ve seen positive performance around the election, there have also been times of significant volatility. Having strong policies in place can allow your organization to invest sensibly, remain disciplined, and act with reason and intention in times of disruption.
If you’d like to review your organization’s investment strategy and policies to ensure you can remain disciplined through market volatility, reach out to us.
Disclosures:
For informational purposes only. All figures in USD. Indices are not available for direct investment. Index returns are not representative of actual portfolios and do not reflect costs and fees associated with an actual investment. Actual returns may be lower.
All economic and performance information is historical and not indicative of future results. Different types of investments involve varying degrees of risk, and there can be no assurance that the future performance of any specific investment, investment strategy, or product made reference to directly or indirectly in this material, will be profitable, equal any corresponding indicated historical performance level(s), or be suitable for your portfolio.
You should not assume that any discussion or information provided here serves as the receipt of, or as a substitute for, personalized investment advice from Raffa Investment Advisers or any other investment professional.
The charts and graphs contained herein should not serve as the sole determining factor for making investment decisions. To the extent that you have any questions regarding the applicability of any specific issue discussed to your individual situation, you are encouraged to consult with Raffa Investment Advisers.
All information, including that used to compile charts, is obtained from sources believed to be reliable, but Raffa Investment Advisers’ does not guarantee its reliability. All performance results have been compiled solely by Raffa Investment Advisers’, are unaudited, and have not been independently verified. Information pertaining to Raffa Investment Advisers’ advisory operations, services, and fees is set forth in Raffa Investment Advisers current disclosure statement, a copy of which is available from Raffa Investment Advisors upon request.