

It’s said that the four most dangerous words to investors are “It’s different this time”. The current political, economic, and market environments sure feel different – but are they? And if they are, what are the likely implications of things truly being different?
Does the current President have more power than past Presidents, and therefore can he single handedly push through more changes?
Since President Trump’s inauguration, we have seen broad and sweeping changes to the way the US has operated for generations. Significant cuts to government personnel, huge cuts in government grants and funding, entire government agencies closed, and the threat of sweeping tariffs at levels not seen in the US in 100 years. Over his first 100 days in office, the President set the record, by a wide margin, for the most executive orders ever issued.
While the President has the backing of Congress and significant support from his party providing more leeway, the difference is he is not operating under historical norms. As a result, many are worried about how so much change has occurred so quickly and believe the potential for a recession this year is high. They feel that this time is different.
However, this isn’t the first time we’ve seen a president deviate from historical norms. There have been multiple previous examples. Franklin D. Roosevelt tried to pack the Supreme Court and broke the two-term tradition. Richard Nixon covered up the Watergate break in and sought to use executive agencies for his personal gain. George W. Bush instituted warrantless surveillance, implemented “enhanced interrogation”, and expanded executive power during the War on Terror. Many Americans had similar concerns at these times as they do today. They feared the President was taking on more power than should be allotted to them. However, we have continued to see the country grow and prosper.
Is the fear, or reality, of tariff-fueled stagflation, different?
Deficit spending, global trade shocks, inflation fears, market volatility – sound familiar? These characteristics were also present the last time we saw stagflation in the US, in the 70’s and 80’s. In the 1970s, the US was fully entrenched in the Vietnam War – large deficits were being ran to finance the war and other social programs, like Medicare and Medicaid. With the Great Depression still visible in the rearview, the Johnson Administration prioritized keeping unemployment low above all else, believing that some inflation could be tolerated now, and corrected later on. Despite inflation creeping up, the White House badgered the Federal Reserve into keeping rates low. Then, in comes the Organization of the Petroleum Exporting Countries (OPEC) embargo on the US, catalyzing inflation after years of loose monetary policy. Inflation skyrocketed, and it wasn’t until years later that the Fed finally intervened by raising rates aggressively, pushing the economy into recession but ultimately bringing inflation back down to tolerable levels from its peak of nearly 15%.
While there are some similarities in today’s economic environment, there are also some key differences. Today’s inflation is more mixed in origin—driven by temporary disruptions and demand surges—unlike the persistent, deeply embedded inflation of the past. The Federal Reserve today is far more credible and proactive, having learned from past mistakes of being reactionary to inflation, and succumbing to political pressure when making policy decisions.
While the degree to which the President has impacted the operations of the Federal government is the most significant seen in decades, that alone is unlikely to tip the country into recession. However, volatile tariff policies certainly could. While some deals have been achieved, there is still significant tariff uncertainty with many of the country’s trading partners. The longer the uncertainty lasts, the greater the impact that could have on consumer and business sentiment, reducing spending, slowing growth, and potentially sending the country into a recession. Even if agreements are reached, it appears likely that there will be higher tariffs than seen since the Smoot-Hawley Tariff Act in 1930 – and the fallout at that time was significant.
After the stock market crash in 1929, unemployment was climbing, and the government adopted a protectionist approach, wanting to protect both American jobs and industries, and encourage consumers to buy American goods rather than importing cheaper foreign goods. Despite the petitioning of over 1,000 economists, the Smoot-Hawley Tariff Act was signed into law, raising the effective tariff rate north of 60%.
As feared, the result of the tariffs was a cascade of negative economic events. Other countries levied retaliatory tariffs, exports declined, unemployment and inflation accelerated, and the Great Depression deepened. Over the next few years, global trade declined by more than 60%.
Isolationist trade policies, retaliatory tariffs, global trade wars… while there are some similarities to be drawn from the Smoot-Hawley tariffs and the Trump tariffs, there are also some key differences. The Smoot-Hawley tariffs were enacted during a recession, when unemployment was high, whereas the Trump tariffs were first enacted during a period of economic expansion, with low unemployment. The Smoot Hawley tariffs were long lasting, aimed at protecting domestic jobs and production from foreign goods. Tariffs from today’s administration are ever changing, levied then paused or erased, aimed at renegotiating trade deals that the administration insists on needing to be rebalanced.
Currently, we believe that the administration is likely to pull back from the most aggressive tariff proposals, and therefore the US is likely to avoid a recession this year. However, the longer the negotiations drag on, and businesses don’t know the rules of the game, the greater the negative impacts. At a minimum, we could likely to see slower growth than in recent years.
Is the current level of market volatility different?
Coming off record highs in February, the Russell 3000 dropped nearly 20% by April as new tariffs started taking effect. Historically, markets have often rebounded from steep intra-year declines to finish in positive territory. Since 2005, there have only been three calendar years where the market ended in negative territory.
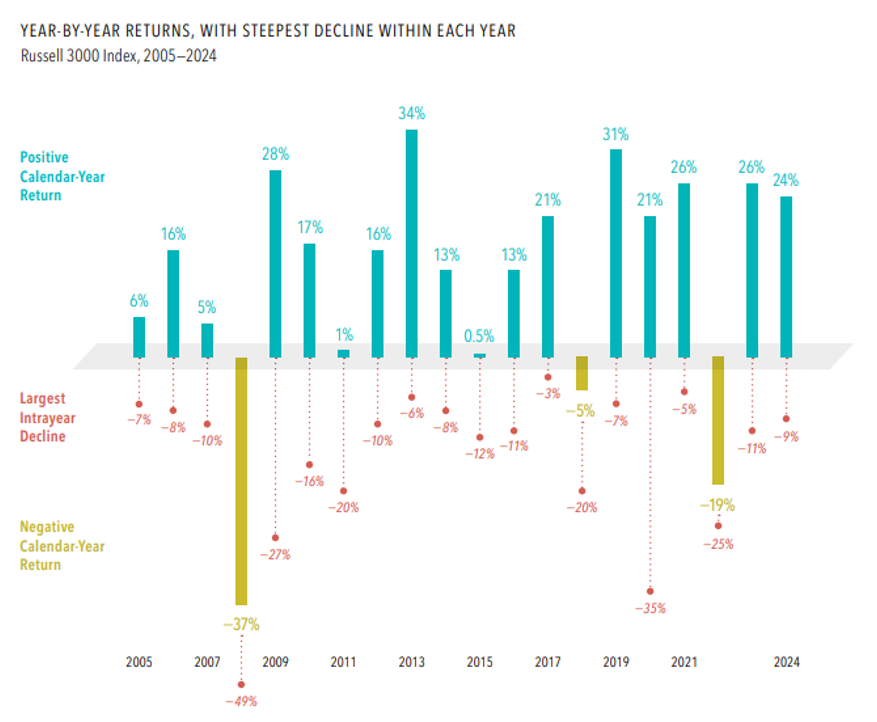
Past performance is no guarantee of future results. Indices are not available for direct investment. Their performance does not reflect the expenses associated with the management of an actual portfolio. In USD. Data is calculated off rounded daily returns. US market is represented by the Russell 3000 Index. Largest intrayear decline refers to the largest market decrease from peak to trough during the year. Frank Russell Company is the source and owner of the trademarks, service marks, and copyrights related to the Russell Indexes.
This chart highlights that sharp market declines don’t necessarily translate into losses by year-end, underscoring that short-term downturns are not reliable predictors of full-year outcomes, and emphasizing the importance of staying disciplined through market volatility. Reacting emotionally to market drops can lead to missed recoveries and long-term underperformance. By maintaining a steady investment approach and focusing on long-term goals, investors are better positioned to benefit from the market’s natural resilience and upward trend over time.
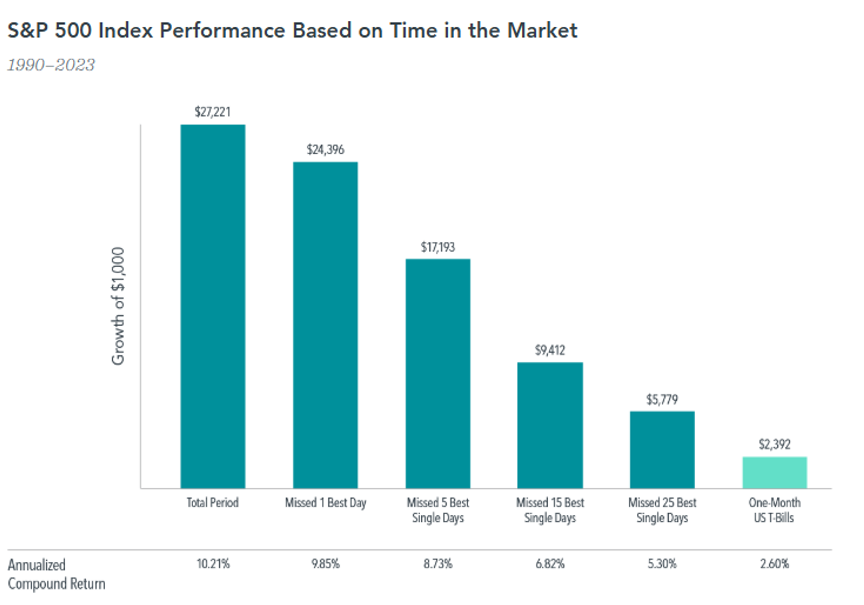
With recent market volatility, it can be tempting to move to the sidelines. The following chart is a timely reminder that missing just a few of the best days, many of which happen during periods of uncertainty, can significantly reduce long term returns. Staying invested remains one of the most effective ways to navigate challenging markets.
Indices are not available for direct investment; therefore, their performance does not reflect the expenses associated with the management of an actual portfolio.
In USD. For illustrative purposes. The missed best day(s) examples assume that the hypothetical portfolio fully divested its holdings at the end of the day before the missed best day(s), held cash for the missed best day(s), and reinvested the entire portfolio in the S&P 500 at the end of the missed best day(s). Annualized returns for the missed best day(s) were calculated by substituting actual returns for the missed best day(s) with zero.
S&P data © 2024 S&P Dow Jones Indices LLC, a division of S&P Global. All rights reserved. One-Month US T-Bills is the IA SBBI US 30 Day TBill TR USD, provided by Ibbotson Associates via Morningstar Direct. Data is calculated off rounded daily index values.
Remaining disciplined and staying invested over time is better than trying to time the market. From 1990 to 2023, a fully invested $1,000 in the S&P 500 grew to over $27,000. But missing even a handful of the best market days drastically reduced returns down to just $5,779 if the 25 best days were missed. These standout days are nearly impossible to predict, often occurring amid volatility. This underscores that trying to time the market can backfire, while staying invested rewards patience and discipline.
In today’s volatile environment, the below chart is a helpful reminder that market declines are often followed by strong recoveries. As mentioned above, the Russell 3000 Index dropped 20% from February to April as new tariffs took effect, but history suggests there’s a strong likelihood of positive returns over the next 1, 3, and 5 years.
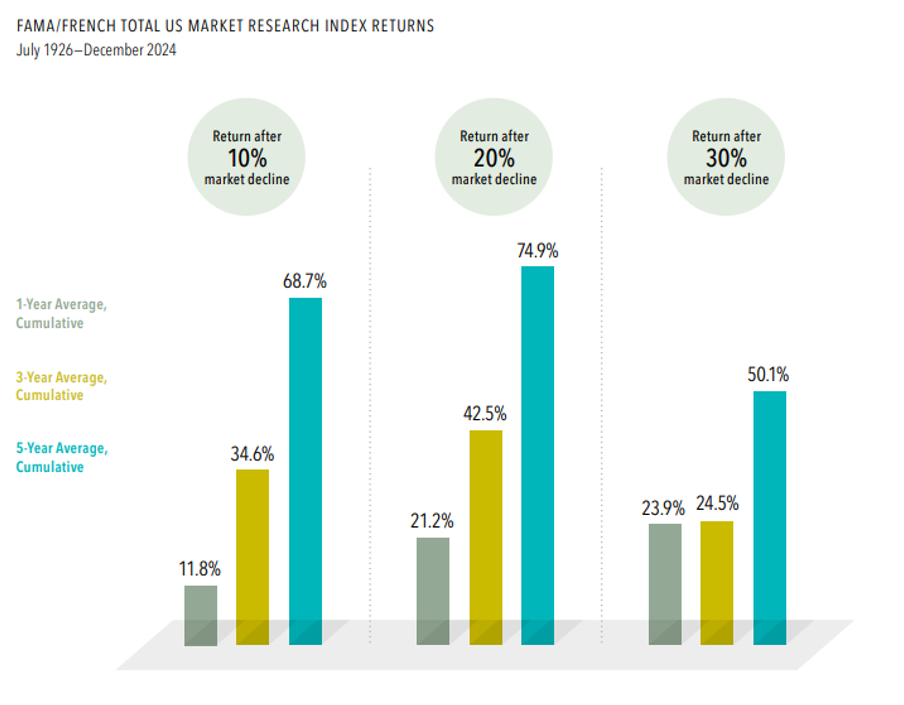
Past performance is no guarantee of future results. Short-term performance results should be considered in connection with longer-term performance results. In USD. Market declines or downturns are defined as periods in which the cumulative return from a peak is −10%, −20%, or −30%, or lower. Returns are calculated for the one-, three-, and five-year look-ahead periods beginning the day after the respective downturn thresholds of −10%, −20%, or −30% are exceeded. The bar chart shows the average returns for the one-, three-, and five-year periods following the 10%, 20%, and 30% thresholds. For the 10% threshold, there are 30 observations for one-year look-ahead, 29 observations for three-year look-ahead, and 28 observations for five-year look-ahead. For the 20% threshold, there are 16 observations for one-year look-ahead, 15 observations for three-year look-ahead, and 14 observations for five-year look-ahead. For the 30% threshold, there are seven observations for one-year look-ahead, seven observations for three-year look-ahead, and six observations for five-year look-ahead. Peak is a new all-time high prior to a downturn. Data provided by Fama/French and available at mba.tuck.dartmouth.edu/pages/faculty/ken.french/data_library.html. Eugene Fama and Ken French are members of the Board of Directors of the general partner of, and provide consulting services to, Dimensional Fund Advisors LP. Fama/French Total US Market Research Index: July 1926–present: Fama/French Total US Market Research Factor + One-Month US Treasury Bills. Source: Ken French website. The Fama/French indices represent academic concepts that may be used in portfolio construction and are not available for direct investment or for use as a benchmark. Index returns are not representative of actual portfolios and do not reflect costs and fees associated with an actual investment. Results shown during periods prior to each index’s inception date do not represent actual returns of the respective index. Other periods selected may have different results, including losses. Backtested index performance is hypothetical and is provided for informational purposes only to indicate historical performance had the index been calculated over the relevant time periods. Backtested performance results assume the reinvestment of dividends and capital gains.
This chart is a reminder that market declines, while uncomfortable, are often followed by periods of recovery and growth. Historically, markets have delivered strong recoveries following significant declines. Rather than signaling a time to retreat, these downturns can actually be opportunities to buy into the market at lower costs and set the stage for future gains. For investors, staying committed to a long-term plan can be more effective than trying to time the ups and downs.
As we navigate the current market environment, it can be helpful to take a step back and look at the bigger picture. The chart below provides valuable perspective on how U.S. stocks have performed over the long term, despite frequent and sometimes significant pullbacks.
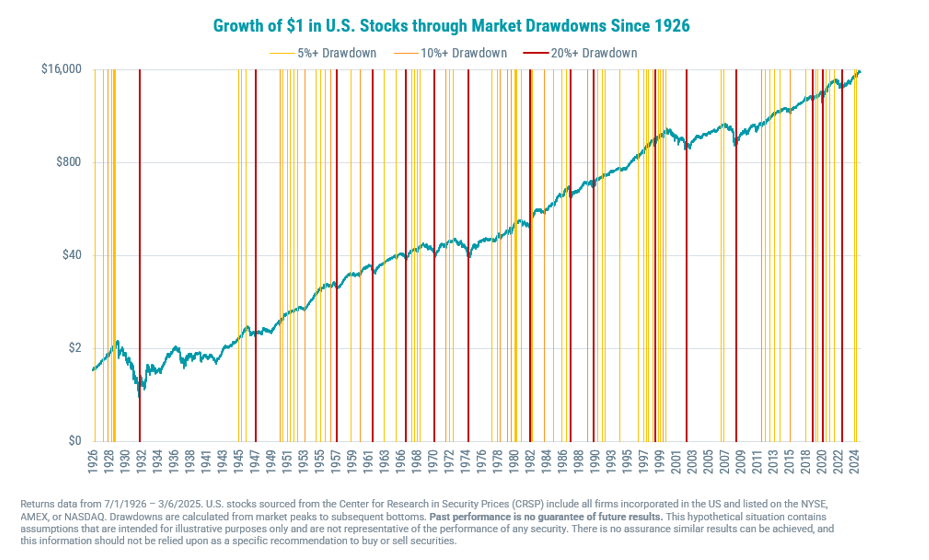
This chart highlights how markets have consistently recovered and grown overtime, despite frequent periods of volatility. There have been numerous market drawdowns, many of which were tied to major economic or geopolitical events. Yet through wars, recessions, inflation spikes, and financial crises, the overall trajectory of the market has remained upward.
It serves as a powerful reminder that downturns are a normal part of long-term investing. While short-term headlines can be unsettling, maintaining a disciplined, long-term approach has historically helped investors stay on track toward their goals. Staying invested during volatile periods has consistently been one of the most reliable ways to achieve long-term financial success.
Conclusion – It is, and it is not, different this time.
Although the details are different and 2025 feels unique, there are many examples where the political, economic, and market environments have been similar to what we’re experiencing now. A charismatic personality dominating the news cycle in the White House is not new. Recession fears, stagflation, and economic uncertainty is not new. Large intra-day stock market volatility is not new. Taking a broad perspective, investing for the long run inevitably means weathering political and economic events that may cause market turmoil. Over the past 50-plus years, investors have experienced challenges, including double-digit inflation, financial crises, and a global pandemic. However, markets have consistently demonstrated their resilience, continually adjusting to new information and rewarding discipline in the long run. Maintaining broad diversification and adhering to a sound financial plan remain reliable ways to stay the course and capture markets’ long-term growth potential.
Disclosures:
Raffa actively leverages Artificial Intelligence (“AI”) and Large Language Models (“LLMs”) within our operations. The use of such technologies, focusing on the safeguard of non-public personal information (“NPPI”), protecting of trade secrets, verification of information accuracy, and other pertinent compliance considerations, is outlined in Raffa’s Compliance Manual and acknowledged by Raffa staff. All viewpoints and final content created was reviewed and approved by the Raffa team to verify accuracy, perspective, and compliance with our marketing guidelines.
For informational purposes only. All figures in USD. Indices are not available for direct investment. Index returns are not representative of actual portfolios and do not reflect costs and fees associated with an actual investment. Actual returns may be lower.
All economic and performance information is historical and not indicative of future results. Different types of investments involve varying degrees of risk, and there can be no assurance that the future performance of any specific investment, investment strategy, or product made reference to directly or indirectly in this material, will be profitable, equal any corresponding indicated historical performance level(s), or be suitable for your portfolio.
You should not assume that any discussion or information provided here serves as the receipt of, or as a substitute for, personalized investment advice from Raffa Investment Advisers or any other investment professional.
The charts and graphs contained herein should not serve as the sole determining factor for making investment decisions. To the extent that you have any questions regarding the applicability of any specific issue discussed to your individual situation, you are encouraged to consult with Raffa Investment Advisers.
All information, including that used to compile charts, is obtained from sources believed to be reliable, but Raffa Investment Advisers’ does not guarantee its reliability. All performance results have been compiled solely by Raffa Investment Advisers’, are unaudited, and have not been independently verified. Information pertaining to Raffa Investment Advisers’ advisory operations, services, and fees is set forth in Raffa Investment Advisers current disclosure statement, a copy of which is available from Raffa Investment Advisors upon request.