With stocks hitting record highs nearly daily in January we heard from many investors that this couldn’t possibly continue. There was a fear that there would be a downturn. This time that sentiment proved to be correct. At the end of the month and beginning of February we saw a significant downswing with US stocks falling 7.6% and international stocks dropping 7.7% from their recent record highs through February 5th. Now we’ve heard from several investors a desire to avoid equity markets and become more conservative because “this could just be the beginning of a sell off.” We believe both sentiments are misplaced.
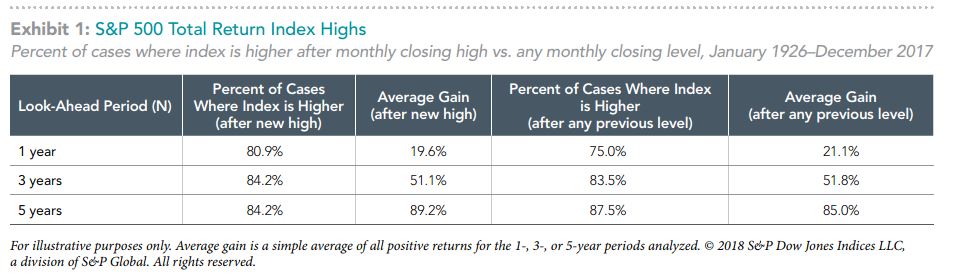
Just because stocks are at a record high does not doom them to weak future returns. The expected return on stocks is positive regardless of where the market stands. Stock prices reflect the discounted value of future cash flows. If those flows become less certain, buyers will want to pay a lower price for that stock. A buyer will only purchase a stock if the price they pay would result in an expected positive return. History bears this out. The following chart shows the S&P 500’s total return comparing month ends with a new closing high compared to any market level. The chart shows the percentage of time the S&P 500 is higher 1, 3 and 5 years later after month ends with new closing highs and any month end. The chart shows that the results are very similar. For example one year after a new month end closing high stocks are up 80.9% of the time compared to any month end they are up 75% of the time. The chart also then compares the cumulative size of the return over those time periods. The gains are very similar across each time frame. Thus historically there has been no disadvantage to investing at a market high.
What about the concern that the market is set for a significant, protracted decline so it’s unwise to buy? Looking back at three of the worst times to buy stock, just before the October crash in 1987, the Dot Com bust in March 2000 and the peak of the market before the Credit Crisis in October 2007, all have had solid positive returns. The market has gained 9.6% annually since October 1987, 5.7% annually since March 2000 and 7.9% annually since October 2007. Even at the worst time to buy, stocks returns have been relatively strong historically. For those three declines the longest it took an investor to recover their investment was roughly 6 years with the shortest being a year and a half. While it’s not a given the next recovery from a decline will be as quick, it shows that with the benefit of time it’s likely that a stock investment will recover and post gains if made at the worst time.
We’ve heard similar concerns about investing in fixed income. We saw interest rates rise noticeably in January. We’ve heard from investors who expect rates to only continue to rise and thus driving down the value of their bond holdings. While an increase in interest rates results in a decline in the value of a bond portfolio in the near term, it results in a higher expected return from the portfolio over time as new bonds are bought at the higher yields. Thus any decline from fixed income holdings driven by a rise in interest rates is only temporary. Fixed income also serves the important role of being a hedge or safe guard against an equity allocation, particularly high quality fixed income. When there is turbulence in the stock market investors flock to safe havens like US Treasuries. In 2008 when the stock market sank 37.3% the broad bond market as measured by the Barclays Aggregate Bond Index held up well gaining 5.2%. High quality bonds did even better rising 11.4%, as reflected by the Barclays Intermediate Treasury Index.
While it may not feel great investing in equities given their recent volatility or fixed income given the rise in interest rates, we believe that it remains prudent to be investing in both to meet you investment goals in a long term portfolio.
| Index Performance | Jan. | Trl 1 Yr |
| US Stock (Russell 3000) | 5.27% | 25.16% |
| Foreign Stock (FTSE AW ex US) | 5.48% | 29.99% |
| Total US Bond Mkt. (BarCap Aggregate) | -1.15% | 2.15% |
| Short US Gov. Bonds (BarCap Gov 1-5 Yr) | -0.58% | -0.08% |
| Municipal Bonds (BarCap 1-10yr Muni) | -0.58% | 2.11% |
| Cash (ICE ML 3Month T-Bill) | 0.12% | 0.93% |
*DFA provided data for this post.
About
Raffa Wealth Management is an independent investment advisor providing nonprofit organizations, high net-worth investors, and qualified retirement plans with a full range of investment consulting services. We were established to fill the need for transparency, clarity, and vision in the professional management of investment assets. Visit us at www.raffawealth.com