

Key Takeaways:
- An effective investment benchmark is static, simple, broadly representative, and aligned with the organization’s Investment Policy Statement (IPS).
- Consistently reviewing performance against investment benchmarks is central to effective nonprofit fiduciary oversight and finance committee governance.
- Investment benchmarks should include carefully selected asset class benchmarks and an applicable policy benchmark for the portfolio as a whole.
- Your ISP should name the specific benchmarks used and the trailing periods over which performance will be evaluated.
- Performance benchmarking and peer benchmarking answer different questions, but both have a role in governance and fiduciary oversight for nonprofits and associations.
Choosing Investment Benchmarks and Monitoring Performance Over Time
Choosing relevant investment benchmarks, and reviewing performance against them consistently, is central to how a nonprofit or association finance committee exercises fiduciary oversight of its reserves. We recommend that committees review portfolio performance against the benchmarks named in their Investment Policy Statement quarterly at minimum.
As a part of this review, we suggest that finance committees consider the following questions to determine if their benchmarks remain aligned with their policy:
- Are the selected benchmarks broad-based in order to provide a representation of the market as a whole?
- Do the benchmarks align with the current investment strategy?
- Is performance being interpreted in a way that supports governance, rather than checking a box?
A carefully-selected benchmark, consistently applied, helps a finance committee separate market-driven results from the impact of the portfolio’s strategy, asset allocation, and manager decisions. When a benchmark is not tied to the Investment Policy Statement, has become too complex or outdated, or has shifted over time without a corresponding change in policy, it becomes harder for finance committee members to fulfill their fiduciary and governance responsibilities.
This article explains:
- What investment benchmarks are
- How nonprofits and associations can identify benchmarks that fit their portfolio
- Examples of commonly used benchmark structures
- Guidance on how a finance committee can monitor performance over time.
What is an Investment Performance Benchmark?
An investment performance benchmark is a neutral market reference point used to evaluate how a portfolio is performing. When your portfolio’s return is compared to the return of a benchmark that represents the same broad market exposure, the benchmark reveals the effect of the decisions your adviser and committee made on top of a baseline market return. A benchmark is not a goal. It is the baseline that reveals whether your investment strategy and associated decisions added value.
Your investment strategy, by contrast, reflects a series of active decisions: target asset allocation, fund or manager selection, and implementation choices such as rebalancing. The benchmark’s role is to make the impact of those decisions visible.
A well-structured investment report uses two kinds of benchmarks:
- Asset class benchmarks: Broad-market indexes used to evaluate specific parts of the portfolio, such as a U.S. equity index for the stock portion and a broad bond index for the fixed income portion.
- Total portfolio (policy) benchmark: A blended index that mirrors the target asset allocation in your Investment Policy Statement. If the policy calls for 60% equities and 40% fixed income, the total portfolio benchmark is a 60/40 blend of the relevant indexes.
To simplify this:
- The benchmark shows how your portfolio may have performed if it simply tracked the broad market at your target allocation (no active investment decisions included)
- Your portfolio’s actual return reflects your active investment decisions
- Comparing the two helps finance committees determine whether the strategy is adding value over time
Why Investment Benchmarks Matter for Fiduciary Oversight
Investment benchmarks give nonprofit boards and finance committees a consistent point of reference across market cycles and board transitions. Without one, results are interpreted on gut feel. A 7% return looks reasonable in isolation. Against a policy benchmark that returned 11%, it looks weak. Against a benchmark that returned 3%, it looks strong. The benchmark is what supplies the context. With a benchmark in place, a finance committee can move past short-term reactions and focus on the question that matters most: over time, has the strategy added value?
Over multi-year horizons, the gap between portfolio results and a carefully-selected reference point is often the single most informative figure in a performance report.
“With a benchmark in place, a finance committee can move past short-term reactions and focus on the question that matters most: over time, has the strategy added value?”
What Makes an Investment Benchmark Effective?
From our perspective, an effective investment benchmark shares four characteristics: it is aligned with the Investment Policy Statement, broadly representative of the underlying asset class, simple enough for committee members to understand, and static over time.
- Aligned with policy: The benchmark should reflect the general structure of the portfolio as laid out in your Investment Policy Statement, including its allocation across major asset classes.
- Broad and representative: A benchmark should rely on widely recognized broad-market indexes rather than narrow or specialized segments. A broad index is a reasonable proxy for an asset class. A sector-specific or thematic fund is not.
- Simple enough to be understood: Every member of your finance committee should be able to look at the benchmark and know what it represents.
- Static over time: An investment benchmark should remain consistent over time and change only when the board formally updates the IPS target allocation, not in response to short-term portfolio adjustments or to make results look stronger. That keeps the comparison meaningful over time and makes the value of the strategy visible.
When these four characteristics are in place, investment benchmarks support consistent oversight through market cycles and leadership changes, and provide nonprofit boards and finance committees with a stable reference point for evaluating the strategy over time.
What Do Common Investment Benchmarks Look Like?
Common investment benchmarks are broad-market indexes that represent a specific asset class, such as the S&P 500 for U.S. large-cap stocks or the Bloomberg U.S. Aggregate Bond Index for core fixed income. Most nonprofit and association portfolios rely on a handful of widely recognized indexes, chosen to match each portion of the portfolio.
We have included a few commonly used benchmarks below, but as the list below is not exhaustive, the benchmarks that are most representative of your investment strategy may differ. We recommend selecting benchmarks alongside your investment adviser or OCIO and carefully aligning them with your Investment Policy Statement.
A Few Commonly Used Benchmarks Include:
Cash and Short-Term Holdings
For short-duration investments such as money market funds, Treasury bills, and other short-term instruments, short-duration interest rate references are common. Examples include:
- The U.S. Department of the Treasury’s daily Treasury bill rates
- FTSE 3-Month U.S. Treasury Bill Index
- ICE BofA U.S. 3-Month Treasury Bill Index
Core Fixed Income
- Bloomberg U.S. Aggregate Bond Index
- Bloomberg U.S. Intermediate Government/Credit Index (for shorter-duration mandates)
- Bloomberg U.S. TIPS Index (for inflation-protected allocations)
U.S. Equities
- S&P 500
- Russell 3000 (broad U.S. market)
- Russell 2000 (U.S. small cap)
International Equities
- MSCI ACWI ex USA Index
- MSCI EAFE (developed markets, ex U.S. and Canada)
- MSCI Emerging Markets Index
Global Equity
For portfolios that do not separate U.S. from international equities, a single global reference is sometimes used:
- MSCI ACWI (developed and emerging markets combined)
- MSCI World (developed markets only)
The benchmarks named in your Investment Policy Statement should reflect your portfolio’s actual structure and be chosen in partnership with a fiduciary adviser, not pulled from a generic template. Wondering whether your current benchmarks are aligned your portfolio?
Where Investment Benchmarking Breaks Down
When benchmarking is less effective than it should be, the issue is usually implementation, not the concept. In our experience, three mistakes show up often enough to be worth flagging.
1) The benchmark does not match the Investment Policy Statement.
An investment benchmark should change when the board formally updates the Investment Policy Statement, such as by adjusting the target allocation or by adding or removing an asset class. In some instances, the investment policy is updated without consideration for the benchmark, and the benchmark carries forward no longer aligned with the policy. For example, if the IPS targets 65% growth assets but the policy benchmark still reflects a 50/50 blend, every performance conversation will be slightly off.
2) The benchmark is changed for the wrong reasons.
A benchmark should not shift in response to short-term portfolio adjustments, manager changes, or to present recent results in a more favorable light. When the benchmark moves every time the portfolio moves, the comparison no longer shows whether those decisions added value, because the benchmark is being shifted to mirror the strategy versus the broader market. Consistency over time is what allows a finance committee to make a true multi-year comparison and see whether the strategy is adding value. A benchmark that moves with the portfolio loses its value as a reference point.
“A benchmark should not shift in response to short-term portfolio adjustments, manager changes, or to present recent results in a more favorable light. A benchmark that moves with the portfolio loses its value as a reference point.”
3) The benchmark is overcomplicated.
When a benchmark is built to match every detail of the portfolio from the start, it can’t serve as an outside reference point. A simpler benchmark, broad enough to represent the asset class without matching every portfolio decision, gives a finance committee a more representative view of whether the strategy has added value.
What Your Reports and Investment Policy Statement Should Cover
Your Investment Policy Statement and your investment performance reports are meant to work as a single governance tool. The IPS names the benchmarks. The performance report shows how the portfolio is doing against them. When the two are aligned, every review begins with a defined standard and a consistent basis for comparison.
Investment Policy Statement
Your investment Policy Statement should clearly define your selected benchmarks and their usage. Including:
- The broad-market indexes used at the asset class level (for example, a specific U.S. equity index, an international equity index, and a core fixed income index).
- The policy (blended) benchmark used at the total portfolio level, weighted to match the target allocation.
- The time periods over which performance will be evaluated. We often see one-, three-, five-, and ten-year trailing periods.
Clearly defining these standards in the IPS helps to create consistency in fiduciary oversight and investment evaluation.
Performance Reports
Reporting is where benchmarking either supports fiduciary oversight or falls short. Your reports should connect portfolio results to clearly defined benchmarks tied to the IPS. If this is not occurring, it is worth discussing with your finance committee and investment advisor. Meaningful oversight typically comes from three views:
- Asset class performance. How the total equity portion of the portfolio performed against a broad equity benchmark, and how the total fixed income portion performed against a broad bond benchmark. This reflects how the portfolio is actually structured and avoids overweighting the significance of any single holding.
- Total portfolio performance. The comparison between the total portfolio and the policy (blended) benchmark, read across the trailing periods specified in the IPS. Over time, this is where the cumulative effect of investment decisions shows up.
- Performance in the context of risk. How the portfolio behaves in weak markets relative to the benchmark, given how the strategy is positioned. A portfolio positioned more aggressively than its benchmark should be expected to outperform in strong markets and trail in weak ones. A portfolio positioned more conservatively should behave the opposite way.
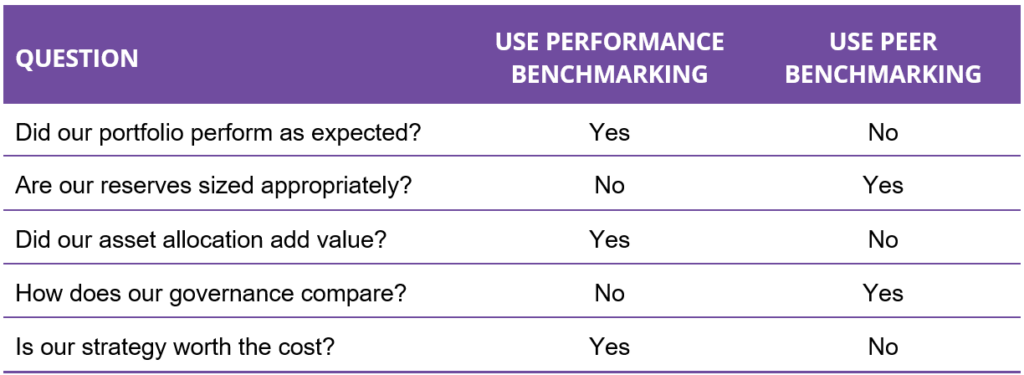
Performance benchmarking vs. peer benchmarking
Performance benchmarks and peer benchmarks answer different questions, and they are not substitutes for each other. Performance benchmarking asks how your portfolio performed relative to a neutral market alternative. Peer benchmarking asks how your organization compares to similar organizations on reserve levels, spending practices, asset allocation norms, governance structure, and overall financial health.
Peer comparisons offer useful context for governance and strategic planning. They are not a replacement for a performance benchmark, because investment results across peers are driven by different allocations, risk tolerances, time horizons, and spending policies. Raffa’s Study on Nonprofit Investing (SONI) dashboard is one example of a peer benchmarking tool built specifically for nonprofits.
The Role of your Adviser
A fiduciary adviser develops a portfolio consistent with the organization’s policy, implements it consistently, and presents results against benchmarks clearly enough that a volunteer finance committee can fulfill its oversight responsibilities. The reporting is designed for committee members, not full-time finance professionals.
Raffa Investment Advisers is a firm built specifically to serve nonprofits and associations. Where benchmarks are unclear, inconsistent with the IPS, or difficult for a committee to interpret, the fix is usually not more complexity. It is a careful rebuilding of the benchmark structure so the report is easier to read and interpret.
Frequently Asked Questions: Investment Benchmarks
What is an investment benchmark in simple terms?
An investment benchmark is a neutral market reference point that shows how a portfolio like yours may have performed if it tracked the broad market at your target allocation, with no active decisions layered on. Comparing your actual results to the benchmark tells you whether the strategy added value.
How should a nonprofit or association choose an investment benchmark?
Benchmark selection should be driven by the structure of the portfolio and the Investment Policy Statement. At the asset class level, a broad, widely recognized index that matches the asset class is usually the right starting point. At the total portfolio level, a blended benchmark weighted to match the target allocation in the IPS is typical. Finance committees generally select benchmarks in partnership with their fiduciary adviser rather than from a generic template.
Should our benchmark change when our investment strategy changes?
In most cases, no. A benchmark is intended to be static. It may be updated when the underlying policy changes, such as when the board formally revises the target allocation, but it should not move in response to tactical shifts within existing policy guidelines. A benchmark that moves with the portfolio loses its value as a reference point.
How often should our finance committee review performance against benchmarks?
We recommend reviewing performance at least quarterly, with a deeper annual review that looks at longer trailing periods. Any single quarter can be heavily influenced by short-term market or economic conditions that have little to do with how the strategy is actually performing. Three-, five-, and ten-year results tend to be more informative because they show how the strategy has held up across different market environments.
Can we use peer benchmarking data from other nonprofits or associations as a benchmark?
Peer benchmarking data does not serve the same purpose as a performance benchmark. Every organization has a different allocation, risk tolerance, and spending policy, so comparing returns directly produces an artificial result. Peer data is better suited to discussions of reserve levels, asset allocation norms, and governance practices.

Dennis Gogarty, CFP®, AIF®
President & Co-Founder
Dennis Gogarty, CFP®, AIF® is President and Co-Founder of Raffa Investment Advisers, a firm he purpose-built to serve nonprofit organizations and membership associations. For more than 20 years, he has advised nonprofits and associations on fiduciary-focused reserve strategy, investment policy development, asset allocation, and governance best practices. Raffa currently serves more than 174 nonprofit clients nationwide (as of December 31, 2025). Dennis is a frequent speaker for nonprofit and association audiences and has presented for numerous organizations including the Council on Foundations, AICPA, BoardSource, and the American Society of Association Executives (ASAE).
Disclosures:
This content is provided for general informational and educational purposes only and does not constitute individualized investment, legal, or tax advice. Raffa Wealth Management, LLC d/b/a Raffa Investment Advisers (“Raffa”) is a registered investment adviser with the SEC. Registration does not imply a certain level of skill or training.
Raffa may leverage artificial intelligence (“AI”) and large language models (“LLMs”) as part of its content development and operational processes. The use of such technologies, including safeguards related to non-public personal information, data security, and accuracy, is governed by Raffa’s Compliance Manual. All viewpoints and final content are reviewed and approved by Raffa to verify accuracy, perspective, and compliance with applicable marketing and regulatory standards.
Any economic, market, or investment information referenced is historical or illustrative and is not indicative of future results. Investing involves risk, including the possible loss of principal. You should not assume that any discussion herein serves as a substitute for personalized investment advice.
Information is obtained from sources believed to be reliable, but its accuracy or completeness cannot be guaranteed. Additional information about Raffa’s advisory services, fees, and business practices is available in Raffa’s Form ADV, which can be obtained upon request or at https://raffaadvisers.com/disclosures/.